Binary Phase Diagram
In the silver/copper binary phase diagram below, an alloy that is 70% copper by weight is fully melted down, then allowed to slowly cool. What temperature does solidification begin at?
Expand Hint
The phase diagram's x-axis represents the alloy's composition weight of silver. The y-axis represents the alloy's temperature.
Hint 2
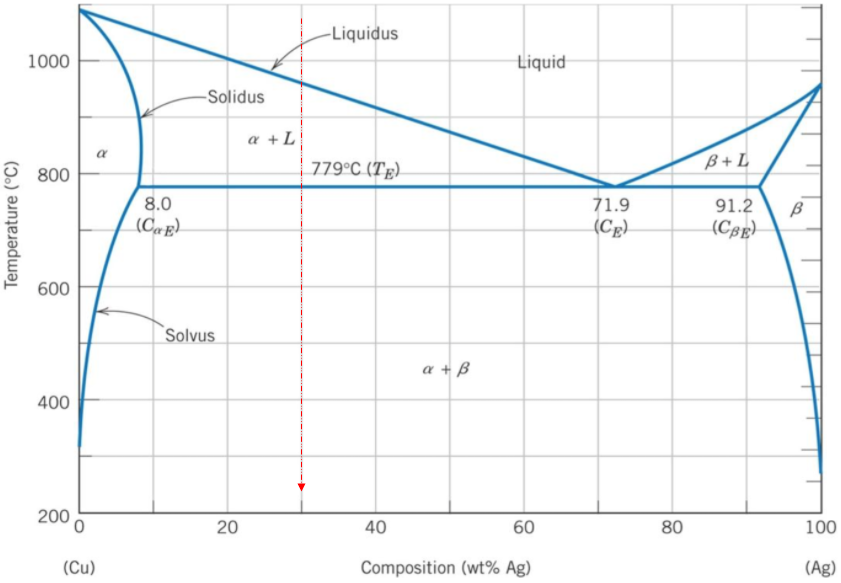
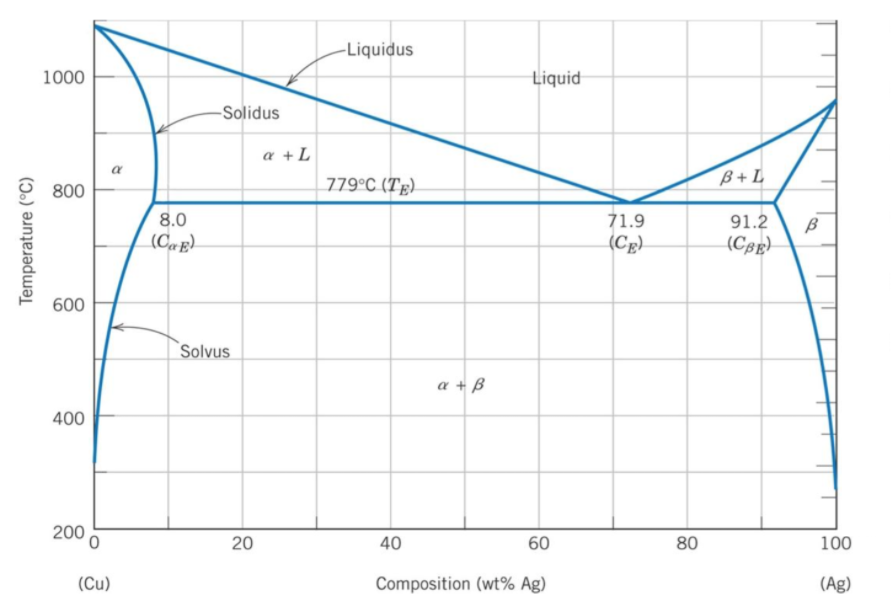
A binary phase diagram shows the phases (solid, liquid etc) formed by mixing two different elements over a range of temperatures. The phase diagram's x-axis represents the alloy's composition weight of silver. The y-axis represents the alloy's temperature. The liquidus line, which joins the three single solidification points (Copper, Silver, & the eutectic point), is the start of solidification curve. If the alloy is 70% copper by composition, then it also contains 30% silver. The vertical line shows the solidification path of the 30% silver as it cools down in temperature. Where the vertical line intersects the liquidus line is at around 960°C.
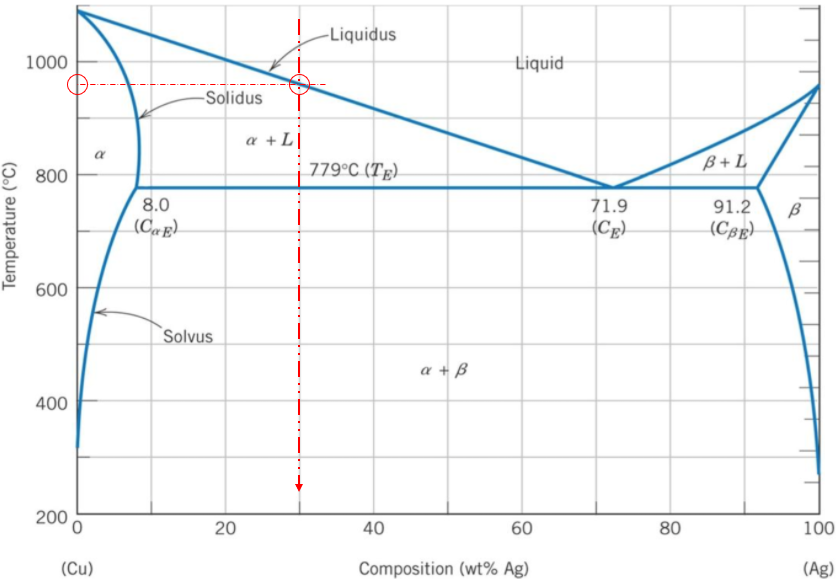
Thus, solidification starts to begin at around 960°C.
960°C
Time Analysis
See how quickly you looked at the hint, solution, and answer. This is important for making sure you will finish the FE Exam in time.- Hint: Not clicked
- Solution: Not clicked
- Answer: Not clicked
Similar Problems from FE Section: Binary Phase Diagrams
232. Phase Diagram
233. Eutectic Composition