Velocity Plots
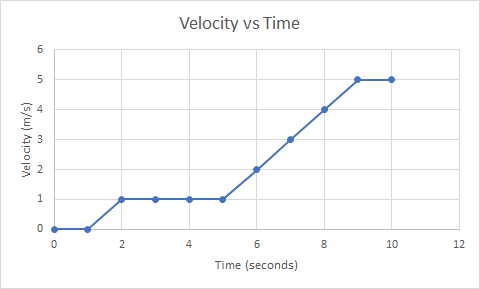
An electron's motion is tracked and plotted in the shown diagram. What is the electron's acceleration between the 5 and 9 second data points in m/s^2?
Expand Hint
Acceleration is defined as:
$$$a=\frac{dv}{dt}$$$
where
$$v$$
is velocity and
$$t$$
is time.
Hint 2
$$$a=\frac{dv}{dt}=\frac{\Delta v}{\Delta t}=\frac{v_{final}-v_{initial}}{t_{final}-t_{initial}}$$$
Acceleration is defined as:
$$$a=\frac{dv}{dt}=\frac{\Delta v}{\Delta t}=\frac{v_{final}-v_{initial}}{t_{final}-t_{initial}}$$$
where
$$v$$
is velocity and
$$t$$
is time.
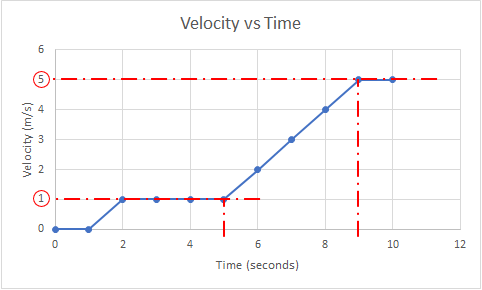
The plot’s x-axis is time and y-axis is velocity. Looking at the graph to find the corresponding velocity values associated with 5 and 9 second observation points:
Therefore,
$$v_{final}=5\:m/s$$
,
$$v_{initial}=1\:m/s$$
,
$$t_{final}=9\:s$$
, and
$$t_{initial}=5\:s$$
. Plugging these values into the acceleration equation:
$$$a=\frac{5m/s-1m/s}{9s-5s}=\frac{4m/s}{4s}=1\:m/s^2$$$
$$$1\:m/s^2$$$
Time Analysis
See how quickly you looked at the hint, solution, and answer. This is important for making sure you will finish the FE Exam in time.- Hint: Not clicked
- Solution: Not clicked
- Answer: Not clicked
Similar Problems from FE Section: Particle Kinematics
018. A Pebble on a Mountain
030. Newton's 2nd Law
037. Motorcycle's Velocity
088. Constant Acceleration
122. Roller Coasters
158. A Train's Velocity
313. Projectile Motion
316. Jet Ski
321. Traveling Train
322. Aircraft Carrier
325. Pebble Off a Building
394. Acceleration
412. Hill Bomb
444. Electron Motion
487. G-Force
488. Block Speed
515. Initial Velocity
556. Golf Angle
635. Downhill Skiing
637. Motor Boat
658. Hockey Puck