Stress vs Strain Curves
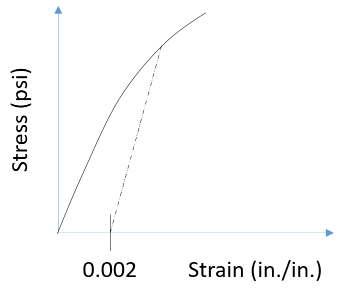
In the stress vs strain graph shown, the solid line represents results from a uniaxial tension test. What material property is associated with the sloped dash line?
Expand Hint
The location where the dash line intersects the stress-strain curve is the yield strength.
Hint 2
This is a stress-strain curve. The straight line implies Hooke’s Law (
$$\sigma=E \varepsilon$$
) is applicable.
Breaking down the stress vs strain curve:
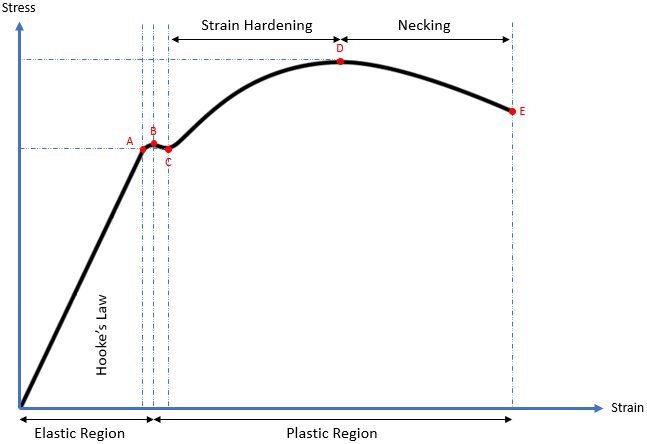
From the origin to Point A, the ductile material is subjected to stress, resulting in a proportional strain. Young’s modulus (modulus of elasticity) is the slope (rise over run) of this section and is the proportionality constant that relates stress (
$$\sigma)$$
and strain (
$$\varepsilon$$
). The straight line implies Hooke’s Law (
$$\sigma=E \varepsilon$$
) is applicable.
From Points A to B, the slope becomes non-linear (Hooke’s Law is not applicable), but deformation is still elastic (the material will return to its original shape). As a result, Point A is known as the proportional limit and Point B is called the elastic point or the upper yield point (the max force a material can withstand elastically).
Additional stress beyond the elastic point will cause the material to enter the plastic region where the material will not return to its original shape after loading (like plastic materials). From Points B to C, both elastic and plastic deformation are occurring. It is not until Point C where the material is fully deforming plastically. Point C is called the lower yield point, and is the curve’s section associated with Yield strength.
When a material undergoes plasticity, the internal molecule structure experiences constant rearrangements. The material naturally resists this change by hardening (also known as strain hardening). As increased stress is applied from Points C to D, the material will elongate along its length (growing thinner and longer) until it reaches Point D, which is the material’s max strength. This section of the curve is associated with the material’s Ultimate (tensile) strength.
Continuing past the Ultimate strength, the material experiences necking where certain cross sectional areas are reducing/elongating locally. It is no longer uniform deformation across the entire material from Points D to E. The neck will grow weaker and thinner until it physically breaks apart at Point E. Point E is known as the fracture or rupture point.
The transition from elasticity to plasticity can be quite subtle for various materials, making it challenging to pinpoint the precise yield point on the stress-strain curve (as in this problem’s case). The 0.2% offset method serves as a reliable and convenient means of determining yield strength. By drawing a line parallel to the linear section of the stress-strain curve (which is essentially equal to the slope of the graph or Young's modulus) at 0.2% of the original gauge length from the origin on the strain axis, we can identify the stress at the intersection of the line and the curve. This associated stress value represents the approximate yield strength, implying that at this point, the material would have undergone a permanent plastic deformation of 0.2% or strain=0.002. This technique is commonly employed for ductile metals like aluminum, which lack a definitive yield point.
The slope of the dashed line is associated with the material's modulus of elasticity (or yield strength or Young’s modulus).
Time Analysis
See how quickly you looked at the hint, solution, and answer. This is important for making sure you will finish the FE Exam in time.- Hint: Not clicked
- Solution: Not clicked
- Answer: Not clicked
Similar Problems from FE Sub Section: Mechanical
004. Stress and Strain
007. Aluminum Alloy Graphs
167. Material Crack
172. Tensile Test
200. Critical Crack Length
315. Composite Material
319. Composite Strain
349. Compressibility Modulus
354. Yield vs Ultimate Strength
358. Brittle vs Ductile vs Plastic
407. Composite Modulus
445. Fracture Toughness
455. Fracture Stress
495. Yield and Ultimate Strength
538. Fracture
636. Base Material
653. Goodman vs Soderberg
Similar Problems from FE Sub Section: Stress-Strain Curve for Mild Steel
007. Aluminum Alloy Graphs
172. Tensile Test
354. Yield vs Ultimate Strength
358. Brittle vs Ductile vs Plastic
653. Goodman vs Soderberg
Similar Problems from FE Section: Properties of Materials
004. Stress and Strain
007. Aluminum Alloy Graphs
167. Material Crack
172. Tensile Test
200. Critical Crack Length
315. Composite Material
319. Composite Strain
349. Compressibility Modulus
354. Yield vs Ultimate Strength
358. Brittle vs Ductile vs Plastic
407. Composite Modulus
445. Fracture Toughness
455. Fracture Stress
495. Yield and Ultimate Strength
538. Fracture
542. Resistivity
544. Conductivity
636. Base Material
653. Goodman vs Soderberg
Similar Problems from FE Section: Uniaxial Stress-Strain
007. Aluminum Alloy Graphs
172. Tensile Test
354. Yield vs Ultimate Strength
358. Brittle vs Ductile vs Plastic
653. Goodman vs Soderberg