Aluminum Alloy Graphs
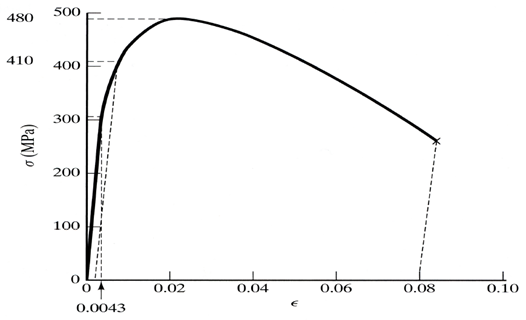
The plot below shows a stress-strain plot for tensile testing an aluminum alloy specimen. Determine the following parameters from this data:
- What is the Elastic Modulus of this material in GPa?
- What is the Tensile Strength of this alloy in MPa?
- What is the Yield Strength of this alloy in GPa?
- What is the ductility of this alloy in %?
Expand Hint
To find the Elastic Modulus, we need to calculate the slope (rise over run) of the initial loading.
Hint 2
Tensile Strength is the highest inflection point. The ductility is determined from the strain at unloading.
Breaking down the stress vs strain curve:
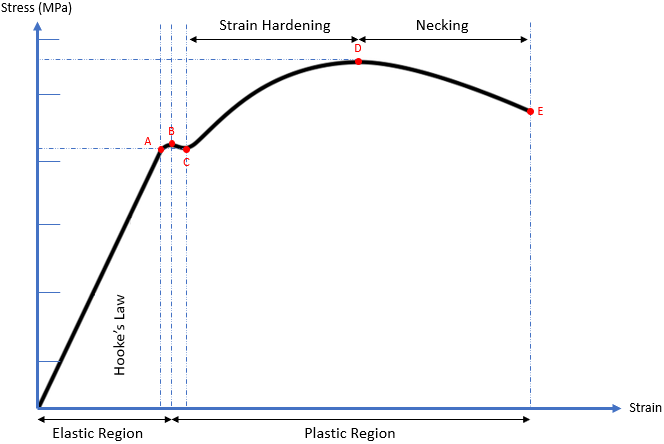
From the origin to Point A, the ductile material is subjected to stress, resulting in a proportional strain. Young’s modulus (modulus of elasticity) is the slope (rise over run) of this section and is the proportionality constant that relates stress (
$$\sigma)$$
and strain (
$$\varepsilon$$
). The straight line implies Hooke’s Law (
$$\sigma=E \varepsilon$$
) is applicable.
From Points A to B, the slope becomes non-linear (Hooke’s Law is not applicable), but deformation is still elastic (the material will return to its original shape). As a result, Point A is known as the proportional limit and Point B is called the elastic point or the upper yield point (the max force a material can withstand elastically).
Additional stress beyond the elastic point will cause the material to enter the plastic region where the material will not return to its original shape after loading (like plastic materials). From Points B to C, both elastic and plastic deformation are occurring. It is not until Point C where the material is fully deforming plastically. Point C is called the lower yield point, and is the curve’s section associated with Yield strength.
When a material undergoes plasticity, the internal molecule structure experiences constant rearrangements. The material naturally resists this change by hardening (also known as strain hardening). As increased stress is applied from Points C to D, the material will elongate along its length (growing thinner and longer) until it reaches Point D, which is the material’s max strength. This section of the curve is associated with the material’s Ultimate (tensile) strength.
Continuing past the Ultimate strength, the material experiences necking where certain cross sectional areas are reducing/elongating locally. It is no longer uniform deformation across the entire material from Points D to E. The neck will grow weaker and thinner until it physically breaks apart at Point E. Point E is known as the fracture or rupture point.
To find the Elastic Modulus, let’s calculate the slope (rise over run) of the initial loading. Strain at the point of loss of linearity (~305 GPa) is the strain value 0.0043.
$$$E=\frac{305MPa}{0.0043}=70.9\:GPa$$$
Looking at the graph, the Tensile Strength is the highest inflection point.
$$$TS=480\:MPa$$$
Looking at the graph, the Yield Strength is:
$$YS=410\:GPa$$
.
Ductility (percent elongation) is the permanent engineering strain after failure. Point E is where the material fails. Because the final strain at failure is 0.08:
$$$EL=\frac{l_f-l_0}{l_0}\times 100=\varepsilon _{final} \times 100=(0.08)(100)=8$$$
where
$$l_f$$
is the final material length and
$$l_0$$
is the inital material length.
- 70.9 GPa
- 480 MPa
- 410 GPa
- 8%
Time Analysis
See how quickly you looked at the hint, solution, and answer. This is important for making sure you will finish the FE Exam in time.- Hint: Not clicked
- Solution: Not clicked
- Answer: Not clicked
Similar Problems from FE Sub Section: Mechanical
004. Stress and Strain
076. Stress vs Strain Curves
167. Material Crack
172. Tensile Test
200. Critical Crack Length
315. Composite Material
319. Composite Strain
349. Compressibility Modulus
354. Yield vs Ultimate Strength
358. Brittle vs Ductile vs Plastic
407. Composite Modulus
445. Fracture Toughness
455. Fracture Stress
495. Yield and Ultimate Strength
538. Fracture
636. Base Material
653. Goodman vs Soderberg
Similar Problems from FE Sub Section: Percent Elongation
648. Elongating
Similar Problems from FE Sub Section: Stress-Strain Curve for Mild Steel
076. Stress vs Strain Curves
172. Tensile Test
354. Yield vs Ultimate Strength
358. Brittle vs Ductile vs Plastic
653. Goodman vs Soderberg
Similar Problems from FE Section: Properties of Materials
004. Stress and Strain
076. Stress vs Strain Curves
167. Material Crack
172. Tensile Test
200. Critical Crack Length
315. Composite Material
319. Composite Strain
349. Compressibility Modulus
354. Yield vs Ultimate Strength
358. Brittle vs Ductile vs Plastic
407. Composite Modulus
445. Fracture Toughness
455. Fracture Stress
495. Yield and Ultimate Strength
538. Fracture
542. Resistivity
544. Conductivity
636. Base Material
653. Goodman vs Soderberg
Similar Problems from FE Section: Definitions
002. Piston Basics
004. Stress and Strain
032. Viscosity Variations
074. Dynamic Viscosity
084. Specific Gravity
174. Elongation
202. Uniaxial Loading
214. Steam Engine Piston
231. Subway Hand Rail
235. Kinematic Viscosity
275. Unpressurized Vessel
309. Strain
317. Utility Pole
332. Bulk Modulus of Elasticity
349. Compressibility Modulus
350. Poisson’s Ratio
374. Test Specimen
403. Train Tracks
446. Viscous Density
451. Poisson
452. Test Coupon
453. Shear Stress & Strain
460. Shear Modulus
463. Newtonian Fluid
467. Bulk vs Shear Modulus
469. Flow Characterization
479. Piston Loading
527. S.G.
530. Spec Weight
534. SW
573. Hooke’s Law
580. Modulus of Elasticity
648. Elongating
Similar Problems from FE Section: Uniaxial Stress-Strain
076. Stress vs Strain Curves
172. Tensile Test
354. Yield vs Ultimate Strength
358. Brittle vs Ductile vs Plastic
653. Goodman vs Soderberg