Yield vs Ultimate Strength
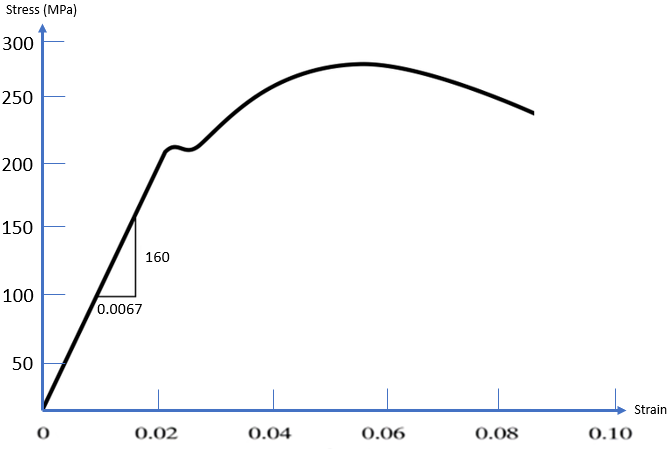
Based on the stress-strain plot below of a ductile material, answer the following:
- What is the Yield Strength of this material?
- What is the Ultimate Strength of this material?
- Explain the differences between Yield and Ultimate Strength.
Expand Hint
Ultimate Strength is the highest inflection point and is measured in MPa.
Hint 2
Because it represents the upper limit of applied forces without causing permanent deformation, Yield strength is commonly used to determine the max allowable load in a design.
Yield strength is the stress at which permanent (plastic) deformation is first observed. At any lowered stress/force value, the material will deform elastically and return to its original shape. Ultimate strength (tensile strength or ultimate tensile strength) is the max allowable stress a material can endure before it starts to break apart. For brittle materials, the yield strength is close to the tensile strength. However, ductile materials can have significantly higher ultimate strengths compared to its yield strength.
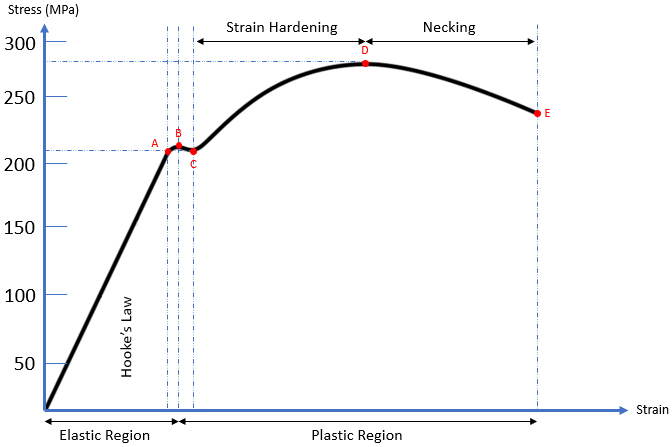
Breaking down the stress vs strain curve:
From the origin to Point A, the ductile material is subjected to stress, resulting in a proportional strain. Young’s modulus (modulus of elasticity) is the slope (rise over run) of this section and is the proportionality constant that relates stress (
$$\sigma)$$
and strain (
$$\varepsilon$$
). The straight line implies Hooke’s Law (
$$\sigma=E \varepsilon$$
) is applicable.
From Points A to B, the slope becomes non-linear (Hooke’s Law is not applicable), but deformation is still elastic (the material will return to its original shape). As a result, Point A is known as the proportional limit and Point B is called the elastic point or the upper yield point (the max force a material can withstand elastically).
Additional stress beyond the elastic point will cause the material to enter the plastic region where the material will not return to its original shape after loading (like plastic materials). From Points B to C, both elastic and plastic deformation are occurring. It is not until Point C where the material is fully deforming plastically. Point C is called the lower yield point, and is the curve’s section associated with Yield strength.
When a material undergoes plasticity, the internal molecule structure experiences constant rearrangements. The material naturally resists this change by hardening (also known as strain hardening). As increased stress is applied from Points C to D, the material will elongate along its length (growing thinner and longer) until it reaches Point D, which is the material’s max strength. This section of the curve is associated with the material’s Ultimate (tensile) strength.
Continuing past the Ultimate strength, the material experiences necking where certain cross sectional areas are reducing/elongating locally. It is no longer uniform deformation across the entire material from Points D to E. The neck will grow weaker and thinner until it physically breaks apart at Point E. Point E is known as the fracture or rupture point.
Based on these definitions, the Yield strength is associated with Point C, which is around 210 MPa. The Ultimate strength is associated with Point D, which is around 280 MPa.
- 210 MPa
- 280 MPa
- Yield strength is the stress at which permanent (plastic) deformation is first observed. Ultimate strength is the max allowable stress a material can endure.
Time Analysis
See how quickly you looked at the hint, solution, and answer. This is important for making sure you will finish the FE Exam in time.- Hint: Not clicked
- Solution: Not clicked
- Answer: Not clicked
Similar Problems from FE Sub Section: Mechanical
004. Stress and Strain
007. Aluminum Alloy Graphs
076. Stress vs Strain Curves
167. Material Crack
172. Tensile Test
200. Critical Crack Length
315. Composite Material
319. Composite Strain
349. Compressibility Modulus
358. Brittle vs Ductile vs Plastic
407. Composite Modulus
445. Fracture Toughness
455. Fracture Stress
495. Yield and Ultimate Strength
538. Fracture
636. Base Material
653. Goodman vs Soderberg
Similar Problems from FE Sub Section: Stress-Strain Curve for Mild Steel
007. Aluminum Alloy Graphs
076. Stress vs Strain Curves
172. Tensile Test
358. Brittle vs Ductile vs Plastic
653. Goodman vs Soderberg
Similar Problems from FE Section: Properties of Materials
004. Stress and Strain
007. Aluminum Alloy Graphs
076. Stress vs Strain Curves
167. Material Crack
172. Tensile Test
200. Critical Crack Length
315. Composite Material
319. Composite Strain
349. Compressibility Modulus
358. Brittle vs Ductile vs Plastic
407. Composite Modulus
445. Fracture Toughness
455. Fracture Stress
495. Yield and Ultimate Strength
538. Fracture
542. Resistivity
544. Conductivity
636. Base Material
653. Goodman vs Soderberg
Similar Problems from FE Section: Uniaxial Stress-Strain
007. Aluminum Alloy Graphs
076. Stress vs Strain Curves
172. Tensile Test
358. Brittle vs Ductile vs Plastic
653. Goodman vs Soderberg