Brittle vs Ductile vs Plastic
Sketch a stress-strain plot for a brittle and ductile material. What about an elastomer?
Expand Hint
Ductility (also called percent elongation) is a material’s ability to permanently elongate in tension. A ductile material will plastically deform (elongate) more than a brittle material.
Hint 2
Here’s an example of a stress vs strain plot of a ductile material:
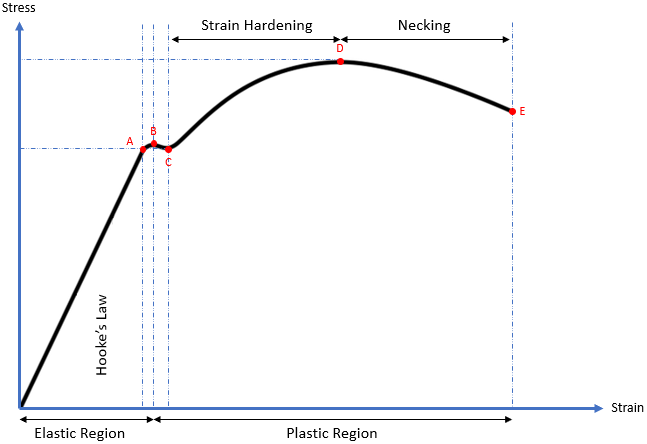
Ductility (also called percent elongation) is a material’s ability to permanently elongate in tension. A ductile material will plastically deform (elongate) more than a brittle material. Let’s first break down the sections of a stress vs strain plot of a ductile material:

From the origin to Point A, the ductile material is subjected to stress, resulting in a proportional strain. Young’s modulus (modulus of elasticity) is the slope (rise over run) of this section and is the proportionality constant that relates stress (
$$\sigma)$$
and strain (
$$\varepsilon$$
). The straight line implies Hooke’s Law (
$$\sigma=E \varepsilon$$
) is applicable.
From Points A to B, the slope becomes non-linear (Hooke’s Law is not applicable), but deformation is still elastic (the material will return to its original shape). As a result, Point A is known as the proportional limit and Point B is called the elastic point or the upper yield point (the max force a material can withstand elastically).
Additional stress beyond the elastic point will cause the material to enter the plastic region where the material will not return to its original shape after loading (like plastic materials). From Points B to C, both elastic and plastic deformation are occurring. It is not until Point C where the material is fully deforming plastically. Point C is called the lower yield point, and is the curve’s section associated with Yield strength.
When a material undergoes plasticity, the internal molecule structure experiences constant rearrangements. The material naturally resists this change by hardening (also known as strain hardening). As increased stress is applied from Points C to D, the material will elongate along its length (growing thinner and longer) until it reaches Point D, which is the material’s max strength. This section of the curve is associated with the material’s Ultimate (tensile) strength.
Continuing past the Ultimate strength, the material experiences necking where certain cross sectional areas are reducing/elongating locally. It is no longer uniform deformation across the entire material from Points D to E. The neck will grow weaker and thinner until it physically breaks apart at Point E. Point E is known as the fracture or rupture point.
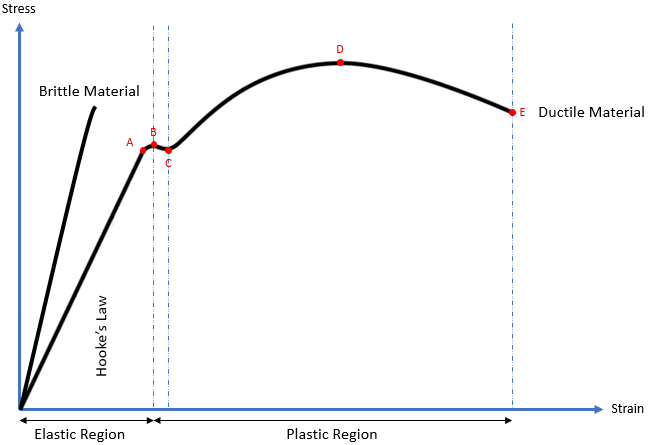
Now that the various parts of a stress vs strain graph are understood, let’s define what a brittle material is. Brittle materials are solid materials that exhibit negligible plastic (permanent distortion) deformation (i.e. glass). The stress-strain plot looks very similar to a ductile material, except it stops short at around Point B (from the ductile plot) because brittle materials don’t exhibit a yielding phenomenon. They’ll suddenly fracture (Point E from the ductile plot) before it enters into the plastic region, meaning failure at typically low strains.
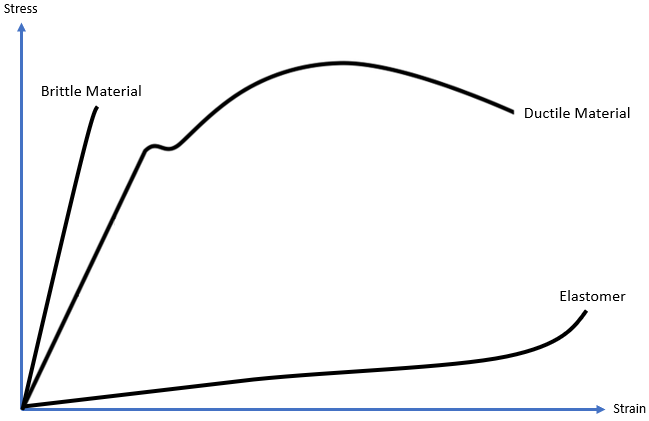
An elastomer is a type of polymer (think plastics) that exhibit rubber like elasticity, and will typically return to its original shape unless the material is extended past its fracture point. As a result, they generally have a low Young’s modulus and high strain failure point compared to ductile and brittle materials.

Time Analysis
See how quickly you looked at the hint, solution, and answer. This is important for making sure you will finish the FE Exam in time.- Hint: Not clicked
- Solution: Not clicked
- Answer: Not clicked
Similar Problems from FE Sub Section: Mechanical
004. Stress and Strain
007. Aluminum Alloy Graphs
076. Stress vs Strain Curves
167. Material Crack
172. Tensile Test
200. Critical Crack Length
315. Composite Material
319. Composite Strain
349. Compressibility Modulus
354. Yield vs Ultimate Strength
407. Composite Modulus
445. Fracture Toughness
455. Fracture Stress
495. Yield and Ultimate Strength
538. Fracture
636. Base Material
653. Goodman vs Soderberg
Similar Problems from FE Sub Section: Stress-Strain Curve for Mild Steel
007. Aluminum Alloy Graphs
076. Stress vs Strain Curves
172. Tensile Test
354. Yield vs Ultimate Strength
653. Goodman vs Soderberg
Similar Problems from FE Section: Properties of Materials
004. Stress and Strain
007. Aluminum Alloy Graphs
076. Stress vs Strain Curves
167. Material Crack
172. Tensile Test
200. Critical Crack Length
315. Composite Material
319. Composite Strain
349. Compressibility Modulus
354. Yield vs Ultimate Strength
407. Composite Modulus
445. Fracture Toughness
455. Fracture Stress
495. Yield and Ultimate Strength
538. Fracture
542. Resistivity
544. Conductivity
636. Base Material
653. Goodman vs Soderberg
Similar Problems from FE Section: Uniaxial Stress-Strain
007. Aluminum Alloy Graphs
076. Stress vs Strain Curves
172. Tensile Test
354. Yield vs Ultimate Strength
653. Goodman vs Soderberg