Goodman vs Soderberg
Consider a material with a known endurance limit of 130 MPa is subjected to cyclical tensile loading during a reliability test. If both the mean and alternating stresses are 125 MPa and 75 MPa respectively, does the modified Goodman theory predict failure? What about the Soderberg theory? Why might these two theories yield different predictions? Assume the ultimate tensile strength is 310 MPa and the tensile yield strength is 280 MPa.
Expand Hint
The modified Goodman theory is a method for predicting the fatigue failure of a material under cyclic loading. It states that fatigue failure will occur whenever
$$$\frac{\sigma_a}{S_e}+\frac{\sigma_m}{S_{ut}}\geq 1\:\:or\:\:\frac{\sigma_{max}}{S_y}\geq 1$$$
if
$$\sigma_m \geq 0$$
where
$$S_e$$
is the endurance limit,
$$S_{ut}$$
is the ultimate strength,
$$S_y$$
is the yield strength,
$$\sigma_a$$
is the alternating stress, and
$$\sigma_m$$
is the mean stress.
Hint 2
The Soderberg theory is a method for predicting the fatigue failure of a material under cyclic loading. It states that fatigue failure will occur whenever
$$$\frac{\sigma_a}{S_e}+\frac{\sigma_m}{S_{y}}\geq 1$$$
if
$$\sigma_m \geq 0$$
where
$$S_e$$
is the endurance limit,
$$S_y$$
is the yield strength,
$$\sigma_a$$
is the alternating stress, and
$$\sigma_m$$
is the mean stress.
The modified Goodman theory is a method for predicting the fatigue failure of a material under cyclic loading. It states that fatigue failure will occur whenever
$$$\frac{\sigma_a}{S_e}+\frac{\sigma_m}{S_{ut}}\geq 1\:\:or\:\:\frac{\sigma_{max}}{S_y}\geq 1$$$
if
$$\sigma_m \geq 0$$
where:
- $$S_e$$ is the endurance limit (the max load level where a material can be cycled indefinitely without failure).
- $$S_{ut}$$ is the ultimate strength (max stress a material can withstand from being pulled before yielding).
- $$S_y$$ is the yield strength (the max load a material can withstand without deforming).
- $$\sigma_a$$ is the alternating stress (subtracting the max and min stress levels and dividing by 2)
- $$\sigma_m$$ is the mean stress (adding the max and min stress levels and dividing by 2)
- $$\sigma_{max}=\sigma_m+\sigma_a$$
$$$\frac{75MPa}{130MPa}+\frac{125MPa}{310MPa}\geq 1$$$
$$$0.5769+0.3871=0.96< 1$$$
Because
$$0.96<1$$
, the
modified Goodman theory predicts that failure will not occur
.
The Soderberg theory is a method for predicting the fatigue failure of a material under cyclic loading. It states that fatigue failure will occur whenever
$$$\frac{\sigma_a}{S_e}+\frac{\sigma_m}{S_{y}}\geq 1$$$
if
$$\sigma_m \geq 0$$
where:
- $$S_e$$ is the endurance limit (the max load level where a material can be cycled indefinitely without failure).
- $$S_y$$ is the yield strength (the max load a material can withstand without deforming).
- $$\sigma_a$$ is the alternating stress (subtracting the max and min stress levels and dividing by 2)
- $$\sigma_m$$ is the mean stress (adding the max and min stress levels and dividing by 2)
$$$\frac{75MPa}{130MPa}+\frac{125MPa}{280MPa}\geq 1$$$
$$$0.5769+0.4464=1.02\geq 1$$$
Because
$$1.02>1$$
, the
Soderberg theory predicts that failure will occur
.
The Soderberg theory is a more conservative method for predicting fatigue failure than the modified Goodman theory because it takes into account the material’s yield strength rather than the ultimate strength. To understand the differences between yield and ultimate strength, let’s break down a stress vs strain curve:
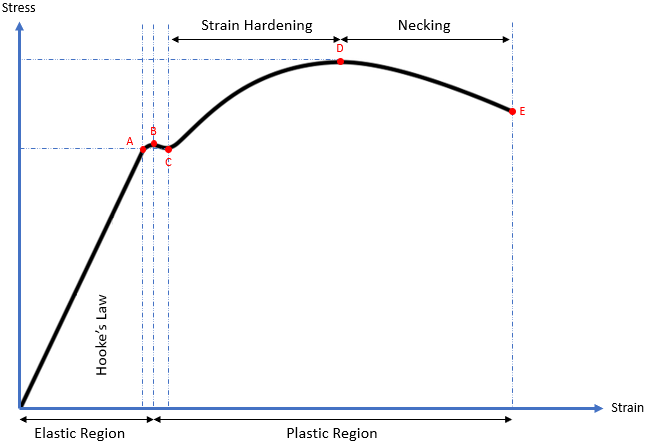
From the origin to Point A, the ductile material is subjected to stress, resulting in a proportional strain. Young’s modulus (modulus of elasticity) is the slope (rise over run) of this section and is the proportionality constant that relates stress (
$$\sigma)$$
and strain (
$$\varepsilon$$
). The straight line implies Hooke’s Law (
$$\sigma=E \varepsilon$$
) is applicable.
From Points A to B, the slope becomes non-linear (Hooke’s Law is not applicable), but deformation is still elastic (the material will return to its original shape). As a result, Point A is known as the proportional limit and Point B is called the elastic point or the upper yield point (the max force a material can withstand elastically).
Additional stress beyond the elastic point will cause the material to enter the plastic region where the material will not return to its original shape after loading (like plastic materials). From Points B to C, both elastic and plastic deformation are occurring. It is not until Point C where the material is fully deforming plastically. Point C is called the lower yield point, and is the curve’s section associated with Yield strength.
When a material undergoes plasticity, the internal molecule structure experiences constant rearrangements. The material naturally resists this change by hardening (also known as strain hardening). As increased stress is applied from Points C to D, the material will elongate along its length (growing thinner and longer) until it reaches Point D, which is the material’s max strength. This section of the curve is associated with the material’s Ultimate (tensile) strength.
Continuing past the Ultimate strength, the material experiences necking where certain cross sectional areas are reducing/elongating locally. It is no longer uniform deformation across the entire material from Points D to E. The neck will grow weaker and thinner until it physically breaks apart at Point E. Point E is known as the fracture or rupture point.
The modified Goodman theory predicts that failure will not occur, while the Soderberg theory predicts the opposite. The Soderberg theory is a more conservative method for predicting fatigue failure than the modified Goodman theory because it takes into account the material’s yield strength rather than the ultimate strength.
Time Analysis
See how quickly you looked at the hint, solution, and answer. This is important for making sure you will finish the FE Exam in time.- Hint: Not clicked
- Solution: Not clicked
- Answer: Not clicked
Similar Problems from FE Sub Section: Modified Goodman Theory
646. Modified Goodman Theory
651. Goodman Failure
Similar Problems from FE Sub Section: Soderberg Theory
647. Soderberg Theory
Similar Problems from FE Sub Section: Mechanical
004. Stress and Strain
007. Aluminum Alloy Graphs
076. Stress vs Strain Curves
167. Material Crack
172. Tensile Test
200. Critical Crack Length
315. Composite Material
319. Composite Strain
349. Compressibility Modulus
354. Yield vs Ultimate Strength
358. Brittle vs Ductile vs Plastic
407. Composite Modulus
445. Fracture Toughness
455. Fracture Stress
495. Yield and Ultimate Strength
538. Fracture
636. Base Material
Similar Problems from FE Sub Section: Stress-Strain Curve for Mild Steel
007. Aluminum Alloy Graphs
076. Stress vs Strain Curves
172. Tensile Test
354. Yield vs Ultimate Strength
358. Brittle vs Ductile vs Plastic
Similar Problems from FE Section: Variable Loading Failure Theories
646. Modified Goodman Theory
647. Soderberg Theory
651. Goodman Failure
Similar Problems from FE Section: Properties of Materials
004. Stress and Strain
007. Aluminum Alloy Graphs
076. Stress vs Strain Curves
167. Material Crack
172. Tensile Test
200. Critical Crack Length
315. Composite Material
319. Composite Strain
349. Compressibility Modulus
354. Yield vs Ultimate Strength
358. Brittle vs Ductile vs Plastic
407. Composite Modulus
445. Fracture Toughness
455. Fracture Stress
495. Yield and Ultimate Strength
538. Fracture
542. Resistivity
544. Conductivity
636. Base Material
Similar Problems from FE Section: Uniaxial Stress-Strain
007. Aluminum Alloy Graphs
076. Stress vs Strain Curves
172. Tensile Test
354. Yield vs Ultimate Strength
358. Brittle vs Ductile vs Plastic